


The Catch-Up Trade Stopped Paying
Category: Business
Share
Archive
Like
For twenty years, buying the beaten-down chip stock was a pretty good way to make money. Then the payoff changed. The trade still wins about as often as it used to. It just hurts a lot more when it loses.
The conclusion first. Since 2002 we have ranked a 35-name AI and semiconductor universe every quarter by trailing 12-month return, bought the bottom quartile against the top quartile, and held for a year. No discretion in the construction. Eighty-eight bets.
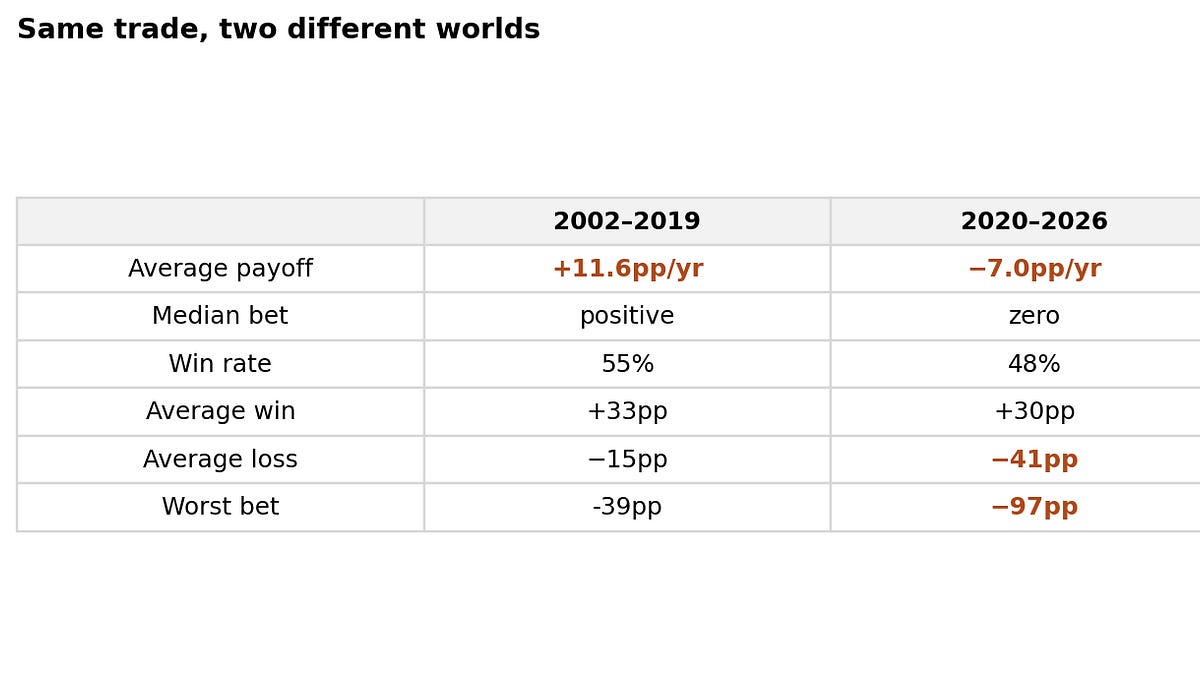
Through 2019, that earned +11.6 percentage points a year. Since 2020 the average is −7, and the median bet is roughly zero.
The first thing to notice is what didnotchange. The laggards still catch up about half the time: 48% of cohorts now, 55% before. If you only ask how often the trade wins, you can come away thinking it is still alive.
The second thing is the problem. When the trade loses, it loses much more than it used to: the average losing cohort went from −15 points to −41, and the worst since 2020 cost 97. The hit rate has not changed much. The payoff has.
For roughly twenty years, semiconductors behaved like a cyclical industry. There were good years and bad years, but a bad year usually did not mean the business had permanently changed. Memory would turn, inventories would clear, capital spending would recover. A company that looked terrible at one point in the cycle could look very different two years later. That made relative underperformance useful information: it was often just a timing question, priced as a business question.
Around 2020 the environment started to look different, and we tested the obvious explanations. The two most popular ones did not survive contact with the data.
Our first thought was that the hierarchy had become more stable: if the same companies stay on top longer, buying laggards naturally gets harder. But the year-over-year correlation of rankings was about −0.03 before 2020 and about −0.03 after. Leadership churns exactly as much as it always did. That explanation does not hold up.
The second thought was that the laggards had become worse businesses, and that the market was correctly looking past companies with no future. The data are not supportive of that either. Since 2020 the laggard quartile has still compounded at roughly 40% a year. The leaders did better, at around 50%. In the worst cohort, the laggards gained 59% while the leaders gained 156%. That is not a story about laggards becoming worthless. It is a story about leaders pulling away.
What actually shows up in the data is three things:
Dispersion doubled: the gap between the group's winners and losers went from about 45 points to about 92. A strategy that depends on losers catching up does not necessarily become less accurate in that world. It becomes more expensive when it is wrong, which is exactly the shape of the first table.
NVIDIA, specifically, explains roughly half the effect. Remove it and the post-2020 average improves from −7 to about −3. A catch-up strategy will always struggle when one company keeps separating itself from the group for years at a time, and part of what looks like a structural change may simply be the footprint of an extreme winner.
And the universe itself changed. Several names in the 35-stock group were not meaningful members before 2020. Restrict the test to the 26 companies that existed in the earlier period and the post-2020 average actually flips slightly positive. That does not mean the old trade is back (the median is still negative), but it makes the story more complicated than 'mean reversion stopped working.'
There are two different questions here, and they deserve different answers.
Is the punishment for losing bigger? Yes, we are reasonably confident. The jump in average losses from −15 to −41 is statistically significant, with a t-statistic of about 2.9.
Has the average return of the strategy permanently shifted lower? We are much less confident. There are only 23 post-2020 cohorts, they partially overlap, and the t-statistic on the change in the mean is around −0.6. We would not claim the catch-up trade is permanently broken, and we would put a genuine one-in-four chance on this being a drought inside a still-working strategy.
What we can say is more modest: the current dry spell is the worst in the 24-year sample, and the economics of losing have clearly changed. It is also not the first drought. The trade went quiet from 2011 through 2015, during the mobile consolidation, and then paid about 10 points a year again from 2016 to 2019 once the memory cycle broadened the industry back out. That history makes us reluctant to declare a permanent regime change. Note also that the recommendations below do not require one. The larger losses justify them on their own.
Intel is the anomaly anyone telling a simple 'the laggard is doomed' story has to deal with. The most famous laggard of the past decade is up roughly 260% since the U.S. government bought about 10% of the company in August 2025 at $20.47. (Intel is not in the 35-name panel, so its rally does not affect any statistic above.)
The anomaly is worth taking apart, because it is not the counterexample it first appears to be. Intel's recovery had very specific catalysts: an $8.9 billion government stake, a $5 billion investment from NVIDIA, an Apple-class foundry customer, a new CEO, and a strategic argument for keeping domestic manufacturing capacity alive. That is not the same thing as buying a stock because it has underperformed. A stock can be cheap because the market missed something, cheap because the business is deteriorating, or cheap while a specific event is about to change its economics. Intel was the third case. The old catch-up trade paid because cycles turn on their own, for free, on schedule. The new one's big wins require someone (a treasury, a rival, a customer) to intervene in the hierarchy directly. That is a real trade. It is an event trade, and it has nothing to do with a screen that sorts by cheapness.
Not 'never.' Three conditions, in order of historical evidence:
1. A capital-spending bust.The strongest catch-up eras followed overbuilt cycles correcting: the 2002–05 cohorts produced about 14.4 points a year, 2006–10 about 25.7, because busts make the industry cyclical again and survivors mean-revert. One warning from the 2000 bust: those jackpots came from the washed-out middle, not from fallen leaders. The prior era's dethroned king stayed dethroned.Tripwire: hyperscaler capex guidance rolling over.
2. Dispersion comes back down.This is the cleanest gauge because it is the proven mechanism. Current dispersion is about 92 against a historical 45; a smaller gap makes it possible for a laggard to close the distance without a dramatic reversal.Tripwire: the quarterly dispersion reading falling below roughly 60.
3. NVIDIA becomes ordinary.The hardest to imagine, and mechanically the most powerful, since one name is half the measured drag. Its stock just logged its longest losing streak since 2022.Tripwire: its trailing-12-month rank outside the top quartile for two consecutive quarters.
Our rule, written down: the systematic catch-up tilt comes back whentwo of the three tripwires fire. Until then, we would not buy a semiconductor laggard because it looks cheap relative to the group. That does not mean avoiding laggards altogether. It means demanding a reason: a named catalyst, a capacity correction, a management change, some identifiable event that can close the gap. And it means sizing those positions like the long shots they are.
There is one trade we would keep separate: the reset. A strong company knocked down for a few weeks because positioning got crowded is not the same as a company that has trailed its peers for years. The first is a positioning problem. The second may be a business problem. They look identical on a screen, and they are different species.
For twenty years the market gave investors a shortcut: if a semiconductor stock fell far enough behind, the cycle would probably bring it back. That experience trained people to buy the cheap one and wait, and the training was correct. That is what makes it dangerous now. The laggards still recover about as often as they ever did. What changed is the loss. And that is enough to change how we play it.
The author and associated persons may hold long or short positions in the instruments mentioned herein. Nothing in this commentary constitutes investment advice, a solicitation, or an inducement to trade. This analysis is published for informational purposes only. Past performance provides no indication of future results. Readers are expected to form their own independent views and, where appropriate, consult professional counsel before acting.
Subscribe now
A note on cookies
Newshunt uses essential cookies to keep you signed in and to remember your language and country, so the site works the way you expect. With your permission, we'd also like to use analytics cookies to understand how people use Newshunt and improve it over time.
Accepting only affects analytics. To learn more, view our Privacy Policy or Terms & Conditions.
(0)Comments