


Chipflation & The Memory Melt-Up: Why This Group Is Priced for Perfection
Category: Financial
Share
Archive
Like
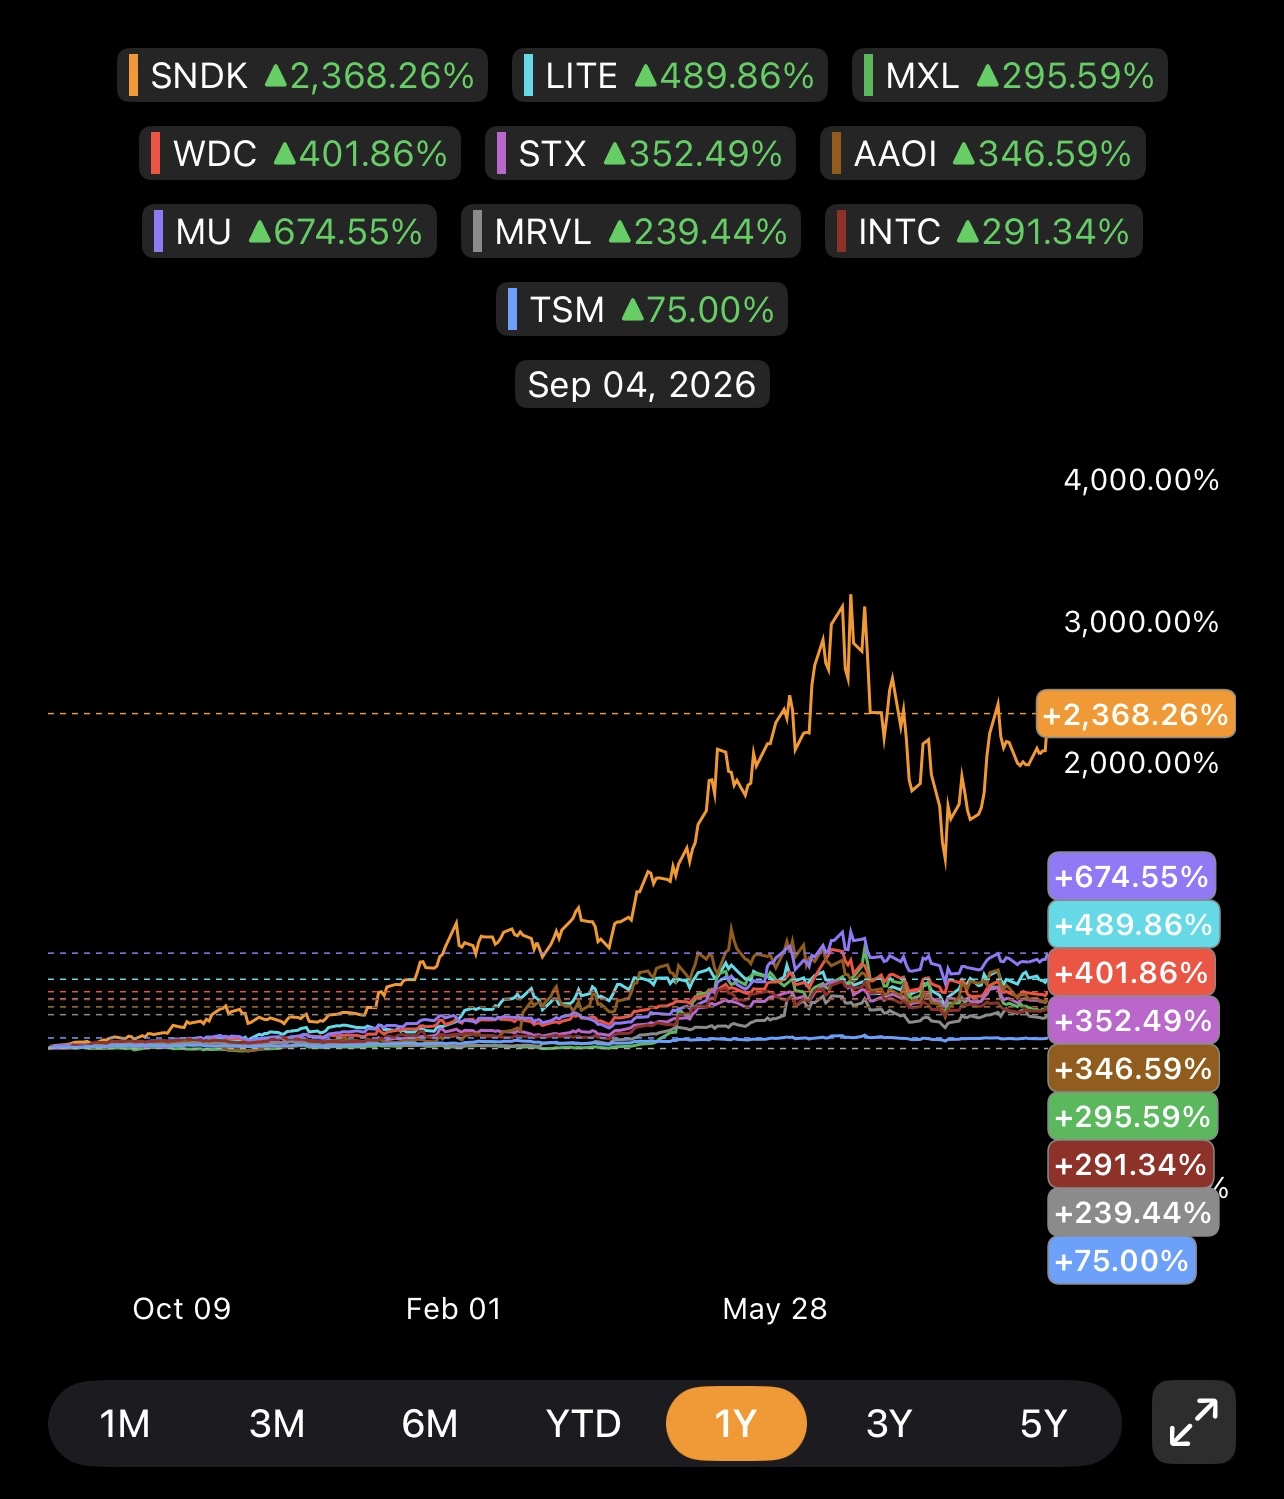
The chart in question is not a semiconductor chart. It is a chart of a commodity price cycle expressed through equities, and it looks exactly like every prior blow-off in memory history — only faster and more levered. Nine of the ten names shown tripled or better in twelve months, led by SanDisk at +2,368%, with Micron at +675% and only TSMC, the least commodity-exposed name in the group, behaving like a normal semiconductor stock at +75%.
The bearish case does not require memory demand to collapse. It only requires the second derivative of pricing to keep decelerating, which is already happening: DRAM contract prices rose roughly 90–95% quarter over quarter in 1Q26, then 58–63% in 2Q26, and are forecast at just 13–18% in 3Q26. Every dollar of the last twelve months of stock appreciation was earned on the acceleration, not the level.
Meanwhile, the same price hikes that produced record margins are now measurable inflation, capex is exploding toward $1 trillion-plus in a way that regulators and central banks are openly flagging, and leverage — record margin debt plus multi-billion-dollar 2x single-stock ETFs — has been layered onto the most volatile trade in the market.
Four of the ten have no trailing earnings at all — LITE, AAOI, MXL and INTC all carry negative trailing P/Es. Those four rose 291% to 490% without profits. That is the single cleanest tell that this is not an earnings-driven re-rating: a large slice of the move has nothing to synchronize with.
The headline P/Es on the profitable names look deceptively cheap, and that is the trap. Micron's trailing multiple of 23x rests on trailing net income that has ballooned to roughly $50.5b over the last four reported quarters, up from about $6.2b the year before — an eightfold increase in twelve months. SanDisk's trailing income swung from a $1.6b loss to $11.4b in profit over the same span. A single-digit-to-low-20s P/E built on peak-cycle earnings is not cheap; it is a cyclical top signature.
The Fundamental Disconnect: Peak Margins Masquerading as Structural
Micron's non-GAAP gross margin hit 84.9% in its fiscal Q3 2026, up from 39.0% a year earlier, with guidance for roughly 86% in Q4. That is the highest margin in the company's history and above Nvidia and Meta. Its ten-year average gross margin is 33.5%. Quarterly revenue went from $7.75b in FY24 Q4 to $41.46b in FY26 Q3 — a 5.3x increase in eight quarters — while gross margin ran from 35% to 85%.
The obvious question is what these businesses earn at a normalized margin. Holding revenue at the current run-rate and simply flexing gross margin back toward historical bands produces multiples that look nothing like the headline numbers:
And that sensitivity is generous, because it holds revenue flat. In prior downturns revenue fell 25–40% at the same time margins compressed. Layer a revenue decline onto margin normalization and the implied multiples go parabolic. Third-party valuation screens already flag the extreme: SanDisk has traded at a price-to-sales ratio near 12.6, roughly 495% above its industry median of 2.11, and one widely followed narrative-based fair value model pegged the stock as 579% overvalued at $2,185.
Western Digital's own reported ratios show what the re-rating looks like in one year: P/E moved from 12.4x to 22.2x, P/S from 2.3x to 15.1x, and P/B from 4.1x to 22.0x between fiscal 2025 and fiscal 2026. The earnings grew — but the multiple grew on top of them, which is the definition of a double-barreled re-rating that reverses violently.
This Is Not Normal Behavior — The Historical Record
The single most important thing for investors to internalize is that memory has never once sustained this. The pattern is documented across three distinct cycles:
• 1993–1996 (Windows PC supercycle): gross margins for leading suppliers surged above 50%, then DRAM prices fell 51% in 1996 and another 65% in 1997; memory stocks fell 60–80% peak to trough, and the shock contributed to the Asian Financial Crisis.
• 2010 (smartphone plus early hyperscaler buildout): DDR3 2Gb contract pricing fell about 46% from its 1H10 peak within months.
• 2017–2023 (COVID cycle): SK Hynix went from record operating profit to a full-year 2023 net margin near negative 28%; Micron's revenue fell to roughly $25b with margins compressing to the low 20s.
The synthesis across all three: a demand-driven boom of 4–7 quarters, an oversupply bust of 4–8 quarters, revenue declines of 25–40%, margins falling from above 50% to low-20s or negative, and stock declines of 50–60% that lead the fundamental peak by one to two quarters. In 2018, Micron's stock topped roughly two quarters before revenue and margins did.
Elevated profitability is itself the mechanism of destruction: it 'drives aggressive capital investment, accelerated capacity expansion, and faster-than-anticipated bit supply growth'. That process is visibly underway.
Everything Is Priced In — And Then Some
Three specific signs that the good news is already in the tape:
The price acceleration has already broken. The gains that drove the melt-up are decelerating sharply, from +90–95% QoQ DRAM in 1Q26 to +13–18% in 3Q26, with NAND slowing from +55–60% to +10–15%. TrendForce attributes the moderation to weaker consumer demand and a higher comparison base. Stocks that were bid on second-derivative acceleration cannot hold multiples when the second derivative goes negative.
The group has already had two 20%+ drawdowns this year. Micron, Samsung, SK Hynix and the Roundhill Memory ETF all fell more than 20% from recent highs in early July, with Yahoo Finance's semiconductor basket shedding roughly $1.5 trillion in market value from June 25 — Micron alone down nearly $350b over that stretch. On July 15, SK Hynix fell about 10%, SanDisk 10%, Western Digital 9% and Micron 8% in a single session. On August 18, Micron fell 5%, SanDisk 6% and Western Digital 7% on nothing more than rising Treasury yields — an explicit valuation reset driven by cost of capital, not fundamentals.
Insiders are selling into it. Micron's CEO Sanjay Mehrotra sold 40,000 shares at $968.90 on August 21 for roughly $38.8m, and Chief Business Officer Sumit Sadana sold 15,000 shares at $934.29 on August 18.
Chipflation: The Price Hikes Are Now a Macro Problem
The price increases that generate these earnings are showing up directly in official inflation statistics, which converts a bullish corporate story into a policy liability.
• The Producer Price Index for electronic components and accessories rose 27.6% year over year in June — the largest increase in records dating back to 1966, exceeding both the dawn of the PC era in 1980 and the pandemic chip crunch.
• Memory prices rose more than sixfold over the prior year, prompting Morgan Stanley to coin the term 'chipflation'.
• Computer prices in the US CPI turned positive year over year for only the second time in fifteen years, running roughly 8% above the long-term trend of a 5.9% annual decline.
• The 'Computer Software and Accessories' PCE category surged at a record 73% annualized rate from November 2025 through March 2026 — nearly triple its previous peak — making an unprecedented contribution to core PCE, which rose 4.4% annualized over those four months.
• Morgan Stanley models a 15 percentage-point increase in the CPI for PCs and smartphones for the year.
Price hikes are not confined to memory. TSMC is raising advanced-node quotes 5–10%, with 7% on CPUs and 10% on AI and HPC processors. Intel raised recommended prices on Core Ultra 200S Plus desktop chips by 15–17% in July, after Intel and AMD signaled average CPU increases of 10–15% earlier in the year. Both Western Digital and Seagate confirmed 2026 hard-drive production is essentially sold out, with some long-term agreements already in place for 2027 and 2028 and no near-term production expansion.
That last point is double-edged for bulls: sold-out capacity means these companies cannot capture upside from further demand, only price — and price is what regulators, OEMs and end customers will fight hardest.
Demand Destruction Is Already Measurable
The bull case rests on inelastic AI demand. The consumer side is already breaking:
• IDC forecasts worldwide smartphone shipments falling 16.7% in 2026 to just over 1 billion units, with second-half shipments down 27.2% year over year, as ASPs rise 27.6% to $581 and NAND/DRAM costs run up over 300% year over year.
• Gartner projected PC shipments down 10.4% and smartphones down 8.4% in 2026 on surging memory costs.
• Memory's share of smartphone bill-of-materials went from roughly 15% to about 35%, and notebook memory share from under 10% to over 20%. In PCs, memory typically accounts for 15–20% of total cost but current pricing has pushed it toward 30–40%.
• PC vendors including Lenovo, Dell, HP, Acer and ASUS have confirmed 15–20% price hikes and contract resets.
Demand destruction of that magnitude is precisely how commodity cycles end. When units fall 10–17% while suppliers are simultaneously adding capacity, the arithmetic turns against pricing with a lag.
Capex: The Supply Response Is Already Funded
Every prior bust was seeded by the capex boom of the preceding upcycle, and the 2026 vintage is the largest ever.
Memory-side supply response: Total industry capex is estimated at $200b in 2026, up 20%, with Micron and SK Hynix each increasing capex by over 40%, and Samsung committing over 110 trillion won ($74b). Samsung and SK Hynix jointly announced 800 trillion won (roughly $520b) for four new fabs plus another 81 trillion won for a packaging hub. SK Hynix's Yongin Y1 fab completes in February 2027 with equipment installation in Q2 2027, first three phases delivering 150,000 wafers per month within that year and another 150,000 at full ramp. Korea's fab investment is projected at $35b in 2026, up 29.6%.
The critical timing point: new Korean capacity arrives in the second half of 2027, and each company is projected to have cleanroom space for an additional 150,000 wafers per month by then. Stocks discount 12–18 months forward. The supply wall is now inside the discounting window.
Demand-side capex risk: UBS projects hyperscaler capex of $1.009 trillion in 2026, $1.447 trillion in 2027 and $1.619 trillion in 2028, totaling roughly $4.1 trillion from 2026–2028 versus $1.292 trillion over the prior six years. Amazon, Alphabet and Microsoft are estimated to spend about 102% of their cloud revenue on capex in 2026. Goldman Sachs estimates roughly $1 trillion of global AI investment in 2026.
Wall Street's tolerance for this is already fraying. The Bank for International Settlements — the central bank of central banks — draws an explicit parallel to the dotcom crash and railway mania, notes that hyperscaler capex is already outpacing earnings and free cash flow, forcing debt issuance to cover the gap, and warns that a disappointment in returns 'could trigger a sudden pullback in financing and turn the capex boom into a protracted investment bust'. Reuters notes the Magnificent Seven hyperscalers spent $234b in capex this year while their stocks barely rose, as investors anticipate free cash flow turning negative for the first time in at least two decades. Allianz observes investor focus has already shifted from profitability to cash-flow visibility given capex plans up roughly 50%.
Then there is the accounting overlay: Michael Burry has estimated the industry understates depreciation by roughly $176b between 2026 and 2028, enough to inflate combined reported earnings by about 20%. Direct AI revenue from these investments sits around $51b against $660–690b of AI-specific 2026 spending — roughly a 10:1 capex-to-revenue ratio.
The memory names are a levered derivative of that capex line. If hyperscalers trim capex growth by even a fraction, memory pricing — which is set at the margin — reprices violently.
The Leverage Overlay: Why the Downside Is Faster Than the Upside
The move up happened with an unprecedented amount of borrowed and structurally levered money attached.
• FINRA margin debt hit a record $1.53 trillion in June, up 7.9% month over month and 51.5% year over year. It had already set a record $1.4 trillion in May, up 54% year over year.
• Net margin debt has climbed back to roughly 1.5% of market cap, near the top of the past decade's range and consistent with prior periods of stretched positioning.
• There are about 448 leveraged equity ETFs holding roughly $192b in assets as of June 2026, and margin debt is now 3.3x the free-credit cash cushion in brokerage accounts.
• Total options volume was up 25% year over year in May, with index options up 33%.
• The Direxion Daily MU Bull 2X ETF (MUU) became the fourth single-stock ETF to cross $5 billion in assets, seeking 200% of Micron's daily return.
Two mechanical consequences follow. First, leveraged single-stock ETFs rebalance daily to maintain constant leverage, which forces them to sell into declines — a structural amplifier of downside on high-volatility underlyings. Second, volatility drag means the more leverage and the more volatile the asset, the greater the shortfall versus the naive multiple over any horizon beyond one day; issuers themselves warn an investor 'could lose the full value of their investment within a single day'.
There is already forensic evidence of this dynamic. In the July selloff, market commentary attributed the severity to profit-taking that triggered forced liquidation of over-leveraged accounts. That is the feedback loop: price drop → margin call → forced sale → deeper drop.
What the Bulls Argue
Intellectual honesty requires stating the counter-case, because it is not trivial.
SK Hynix's CEO sees the worst memory shortage arriving in 2027, with demand outstripping supply beyond 2030, and UBS forecasts DRAM shortage persisting until at least Q2 2028. Synopsys' CEO expects shortages through 2027. SK Hynix argues meaningful double-ordering is unlikely because customers know overbooking secures no extra allocation and only drives prices higher, and reports DRAM and NAND inventories at a normal four weeks. Some analysts contend hyperscalers are receiving only 50–70% of the memory they need on six-week inventories, and that orders are tied to funded, scheduled data centers rather than speculative hedges — meaning there is no phantom inventory to flood back into the channel. A structural-bull framing argues memory has shifted from standardized commodity to differentiated product with durable pricing power, implying shallower downturns and higher through-cycle profitability.
But there is contradictory evidence on the core inventory question. Reports describe buyers double- and triple-ordering with module makers stockpiling aggressively, distributors unable to hold quotes because prices change daily, and spot price increases of roughly 11x in half a year — behavior the same source characterizes as a speculative squeeze rather than normal industry conduct. Micron's own CEO has framed the shortage as partly a legacy of years of underinvestment rather than pure demand strength.
Critically, even the bulls' timeline concedes the key bearish point: relief and normalization arrive in 2027–2028. Stocks discount that window now.
What Would Break the Trade
The specific catalysts to watch, in rough order of probability:
• A quarter where memory contract prices are flat or negative sequentially, following the 92% → 60% → 15% deceleration path.
• Any hyperscaler guiding capex growth below consensus, given that free cash flow is already projected to turn negative.
• Rising long-term yields compressing multiples independent of fundamentals, exactly as occurred on August 18.
• Accelerated depreciation schedules or writedowns at AI infrastructure buyers, forcing earnings revisions.
• Unit demand destruction exceeding the ASP benefit, turning revenue growth negative even at high prices.
• The 2H27 Korean capacity wall becoming a consensus 2027 estimate.
• Political or regulatory attention to 'chipflation' given record PPI prints and CPI contributions.
Why P/E Is the Wrong Tool Here — And Market Cap Is the Better One
The single most dangerous number in this entire group is the trailing P/E, because it is doing the opposite of its job. Micron at 23x, SanDisk at 24x and Western Digital at 19x all screen cheaper than the S&P 500 average, and that is precisely what has given the melt-up its intellectual cover.
The four ways P/E breaks on a cyclical
It divides by a number that is itself the bubble. P/E is price divided by earnings, so if earnings are at an unsustainable peak, the ratio shrinks even as risk grows. Micron's trailing net income went from roughly $6.2b to $50.5b in twelve months against a ten-year average gross margin of 33.5% versus 85% today. The denominator inflated faster than the numerator, so the ratio fell while the stock rose 675%. A low P/E on peak earnings is not a value signal — it is a warning that the market does not believe the earnings either.
It cannot be computed at all for a third of the group. LITE, AAOI, MXL and INTC have negative trailing P/Es, meaning the metric returns nothing usable for four names that rose 291% to 490%. Any framework that goes silent on 40% of your sample is not a framework.
It is backward-looking on assets whose value is forward-looking. Trailing earnings describe a pricing environment — DRAM up 90% QoQ — that is already gone, with 3Q26 forecast at just 13–18%. The P/E is measuring a quarter that will not repeat.
It ignores the balance sheet entirely. P/E says nothing about debt, cash, or capital intensity. These are businesses committing over 40% capex increases, where Samsung and SK Hynix alone are deploying 800 trillion won on four new fabs. Earnings that must be recycled into fabs to defend share are worth less per dollar than earnings that convert to free cash.
What market cap tells you that P/E hides
Market cap is the absolute price tag — what you are actually being asked to pay for the whole business, with no cyclical denominator to hide behind. It answers a different and more honest question: is this a plausible amount of money for this asset?
The contradiction is stark. Every P/E in that table looks reasonable. Every market cap change is absurd. SanDisk's equity value went up roughly 38-fold in about fifteen months — from under $7b to $264b — while its P/E stayed a comfortable-looking 24x. P/E normalized the insanity; market cap exposed it.
Market cap also lets you sanity-check against the size of the actual end market, which P/E cannot do. Micron, SanDisk, Western Digital and Seagate now carry a combined equity value of roughly $1.78 trillion against total DRAM plus NAND industry revenue estimated near $290b for 2026. That is about 6.1x the entire industry's annual sales capitalized into four companies. The full ten-name group in the chart is worth roughly $4.87 trillion. For scale, TSMC — the most strategically entrenched and least commodity-exposed name in the group — is $2.28 trillion and rose only 75%, the one member behaving like a normal semiconductor business.
How to actually use both
Neither number works alone. The practical discipline is:
• Use market cap to ask what you are paying in absolute dollars, and whether that figure is defensible against the size of the end market, replacement cost of the fabs, or the company's own history.
• Use P/E only on normalized earnings, not trailing peak earnings. Flexing Micron's margin back to 35% takes the multiple from 23x to 51x at unchanged revenue — and prior busts brought revenue down 25–40% simultaneously.
• Cross-check with price-to-sales and price-to-book, which are far more stable through a cycle because the denominators do not swing eightfold. SanDisk's P/S of 12.6 sits roughly 495% above its industry median of 2.11, and Western Digital's P/B moved from 4.1x to 22.0x in a single fiscal year.
• Watch enterprise value rather than market cap when leverage matters, and free cash flow yield rather than earnings yield when capex is exploding.
The general lesson for readers: a low P/E tells you earnings are high right now, not that the stock is cheap. On a commodity cyclical, those two things are frequently opposites.
S&B Research Conclusion
The chart shows a group where nine names tripled or better in a year, four of them without any trailing profits, on the back of the fastest commodity price spike in the industry's recorded history. Trailing P/Es in the 19–24x range are an artifact of eightfold earnings growth that the entire documented history of this industry says is temporary. Normalize margins toward even 35–50% and the same market caps imply 34–64x earnings without assuming any revenue decline.
Around that, three exogenous pressures are building simultaneously: the price hikes are now measurable, record-setting inflation that invites policy attention; a $1 trillion-plus capex cycle that the BIS explicitly compares to railway mania and warns could flip into a protracted investment bust; and record leverage — $1.53 trillion of margin debt plus multi-billion-dollar 2x single-stock vehicles that mechanically sell into weakness.
The asymmetry is the whole point. Nothing about a 2,368% twelve-month return is normal, and the same reflexivity — leverage, momentum, price acceleration — that manufactured it works identically in reverse. Prior memory busts delivered 50–80% peak-to-trough stock declines, and they began one to two quarters before the fundamentals rolled over.
And the reason so many investors cannot see it is the P/E. Nineteen to twenty-four times earnings feels safe. But a P/E built on an eightfold earnings spike is measuring the peak, not the price — which is why the market cap is the number that matters. SanDisk's equity value rose roughly 38-fold to $264b while its P/E barely moved. Four companies now carry $1.78 trillion of market value against an industry that will sell about $290b of product this year. That is the figure to write down, because unlike the P/E, it does not get cheaper when the good quarter arrives.
Cheers
A note on cookies
Newshunt uses essential cookies to keep you signed in and to remember your language and country, so the site works the way you expect. With your permission, we'd also like to use analytics cookies to understand how people use Newshunt and improve it over time.
Accepting only affects analytics. To learn more, view our Privacy Policy or Terms & Conditions.
(0)Comments