


August 2026 Active Portfolio Update: Portfolio Crosses $400,000 Intramonth Before Finishing Down 1.20%
Category: Financial
Share
Archive
Like
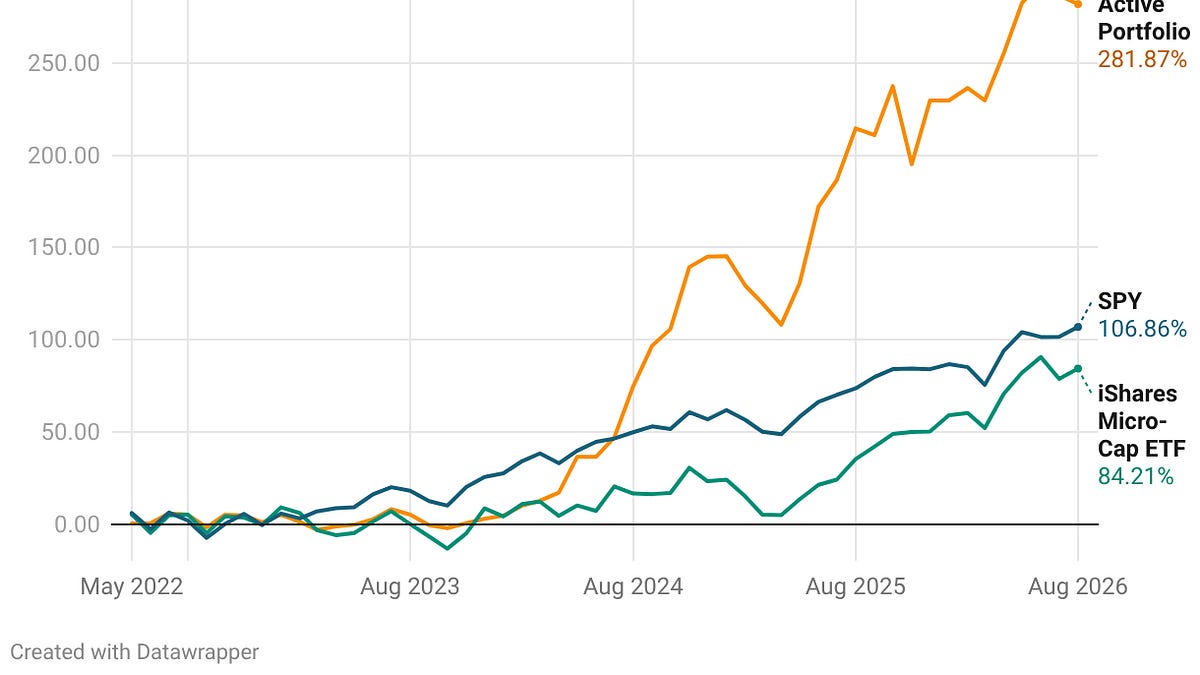
August was a mixed month for the Active Portfolio (AP). The portfolio declined1.20%and ended the month at$381,870.46, compared with$386,522.79at the end of July. The average return performance since inception stands at281.87%, with a37%compound annual growth rate (CAGR).
The month was more eventful than the final return suggests. For the first time, the AP crossed the$400,000mark, reaching an intramonth peak of$403,142, equivalent to a high return of303.14%.
Those gains did not hold through month-end. The portfolio finished August lower even as the NASDAQ gained3.93%, the iShares Micro-Cap ETF (IWC) gained3.10%, and the SPY gained2.68%.
The underlying performance was highly selective. Several holdings produced double-digit gains, led by $KLNG, $FSI and $HMM.A, but those gains were more than offset by weakness in $KTEL, $PXHI and $IFABF.Regardless, the AP, holds a wide alpha edge over the major indexes.
To see the Corporate Actions related to the stocks in the AP, such as dividends, please gohere. To see all the stocks in the AP, please gohere.
The chart below shows a quick view of how Active Portfolio capital is distributed across sectors at month-end:
The chart below shows how Active Portfolio capital was allocated across the stocks it holds at the end of June.
A note on cookies
Newshunt uses essential cookies to keep you signed in and to remember your language and country, so the site works the way you expect. With your permission, we'd also like to use analytics cookies to understand how people use Newshunt and improve it over time.
Accepting only affects analytics. To learn more, view our Privacy Policy or Terms & Conditions.
(0)Comments